A reliable electricity network is defined not only by how much power it generates or how many customers it connects, but by its ability to deliver electricity consistently, maintain acceptable operating conditions and recover quickly from disruptions. For power utilities, achieving this is becoming more difficult as networks age, demand patterns change, distributed generation increases and operational information remains fragmented across multiple systems. The priority is to turn that information into a timely, coherent understanding of network condition and operational risk.
The reliability challenge is changing
Electricity networks face growing operational complexity. Ageing infrastructure, changing demand patterns, increasing distributed generation, extreme weather and equipment failures can expose weaknesses across interconnected assets. At the same time, information is often spread across SCADA, outage management, GIS, metering, maintenance and asset-management systems.
The challenge is no longer simply collecting more grid data. Utilities need to understand network conditions as they change, identify emerging risks and connect operational signals to the assets and locations that require attention.
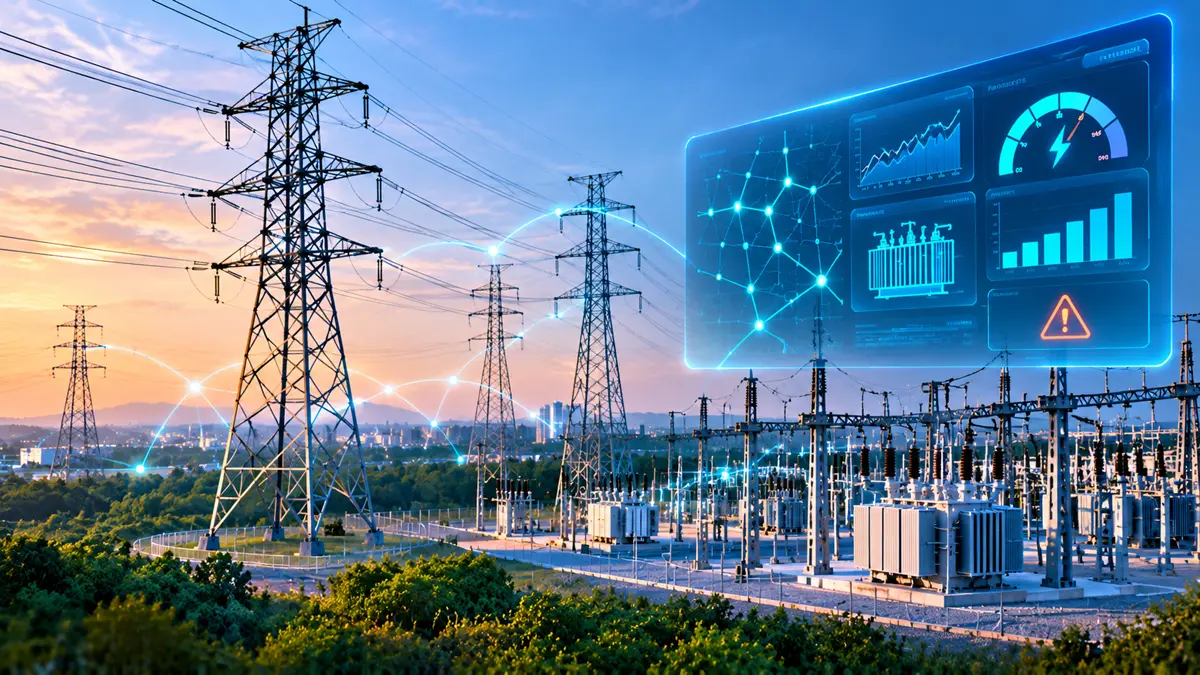
Reliability requires more than outage statistics
Utilities commonly use established indicators to understand distribution performance:
SAIDI: Average interruption duration experienced by customers.
SAIFI: Average frequency of customer interruptions.
CAIDI: Average restoration time for interrupted customers.
CEMI-4 / CEMI-5: Measures the number of customers experiencing repeated interruptions above defined thresholds.
These indicators are valuable for understanding performance over time. However, they are largely outcome measures: they show what customers experienced, not necessarily what is about to fail or where intervention is most urgent. IEEE 1366 provides a recognised framework for distribution reliability indices, including their application to circuits, substations and defined regions.
A more effective approach combines these measures with operational indicators such as transformer health, feeder loading, voltage and frequency deviations, protection events, equipment alarms, fault recurrence, outage location and restoration progress.
Build a connected view of grid operations
A utility's operational picture is usually distributed across several systems. SCADA and telemetry provide visibility into electrical conditions and equipment status. GIS and asset registers establish where network assets are located and how they are connected. Outage Management Systems (OMS) capture interruption events, affected customers and restoration activity. Advanced Metering Infrastructure (AMI) and metering data help identify consumption patterns and service interruptions, while maintenance systems contain inspection findings, work orders, repair history and asset condition records.
The value comes from correlating these sources. A transformer alarm becomes more useful when viewed alongside its loading history, recent maintenance, feeder topology and outage record. A recurring feeder interruption becomes more actionable when it can be linked to the physical assets and field locations involved. This connected view helps control-room, engineering, maintenance and field teams work from consistent information.
Connect grid data to operational decisions.
Bring SCADA, GIS, outage, metering and maintenance information into a shared operational view so teams can understand asset condition, identify network risks and coordinate timely intervention.
Talk to our teamShift from reactive maintenance to predictive intervention
Traditional maintenance programmes often rely on fixed schedules, periodic inspections and responses after equipment failure. These remain necessary, but they can miss developing problems between inspection cycles. Condition-based and predictive approaches use equipment measurements, operating history and maintenance records to identify changes that may indicate deterioration.
Abnormal temperature, repeated protection operations, unusual vibration or a sustained increase in transformer loading can trigger closer investigation. Analytics can help prioritise assets by combining condition, criticality, failure history and the consequences of service interruption. The output should be a ranked list of risks and recommended inspections or engineering assessments, not an automatic instruction to operate or isolate equipment. Qualified personnel must validate findings and retain control of safety-critical decisions.
Make outage response an end-to-end workflow
Reliability improves when detection, diagnosis, dispatch and restoration are connected. A practical workflow has five stages:
1. Detect: Identify an outage, abnormal grid condition or asset-health warning.
2. Locate: Map the event to the affected feeder, substation, transformer or field asset.
3. Assess: Correlate alarms, network topology, asset condition and event history to support diagnosis.
4. Respond: Assign the appropriate control-room, engineering or field team, with clear escalation and safety procedures.
5. Verify: Confirm restoration, record the cause and corrective action, and monitor whether the problem recurs.
Connecting these stages reduces the risk of fragmented hand-offs between control rooms, maintenance teams and field crews. It also creates a traceable record that can support root-cause analysis and future planning.
Reliability improves when detection, diagnosis, dispatch and restoration are connected, with a traceable record of the action taken and the outcome achieved.
Reliability must evolve into resilience
Reliability focuses on the continuity and quality of electricity supply under expected operating conditions. Resilience adds the ability to withstand, adapt to and recover from more severe disruptions.
A resilient utility needs to understand asset criticality, network dependencies, alternative supply paths, spare equipment availability, crew readiness and restoration priorities. Scenario analysis can help teams examine the consequences of equipment outages, extreme weather, demand surges or loss of visibility from operational systems.
The distinction matters: a network may perform well under normal conditions yet remain vulnerable to a low-frequency, high-impact event. FERC's explanation of reliability distinguishes reliable operation from resource adequacy, while emphasising the need to withstand disturbances and isolate problems so the wider system can continue functioning.
Measure what drives improvement
A connected reliability programme should track customer experience alongside asset condition, network operation, response performance, preventive action and resilience. Example measures include:
| Performance dimension | Example measures |
|---|---|
| Customer experience | SAIDI, SAIFI, CAIDI, repeat interruptions |
| Asset condition | Transformer health, equipment alarms, overdue inspections |
| Network operation | Loading, voltage deviations, congestion, fault frequency |
| Response performance | Detection time, dispatch time, restoration time |
| Preventive action | Risk-based maintenance completion, recurring fault reduction |
| Resilience | Critical asset exposure, restoration readiness, scenario performance |
From grid visibility to dependable service
A modern reliability programme is not simply a dashboard project or a predictive-maintenance deployment. It is an operating model that connects network data, asset intelligence, engineering judgement and field execution. Utilities that build this capability can identify emerging risks earlier, direct maintenance to the assets that need it most, coordinate outage response more effectively and learn from recurring failures.
The ultimate measure is not how much data the grid produces, but whether the utility can use that information to prevent avoidable interruptions, restore service faster and maintain dependable electricity supply as the network evolves.