SAIDI/SAIFI/CAIDI KPI Dashboards
Move beyond manual, post-outage calculations with automated reliability KPI monitoring, feeder-level visibility and consistent reporting across utility operations.
Explore the use case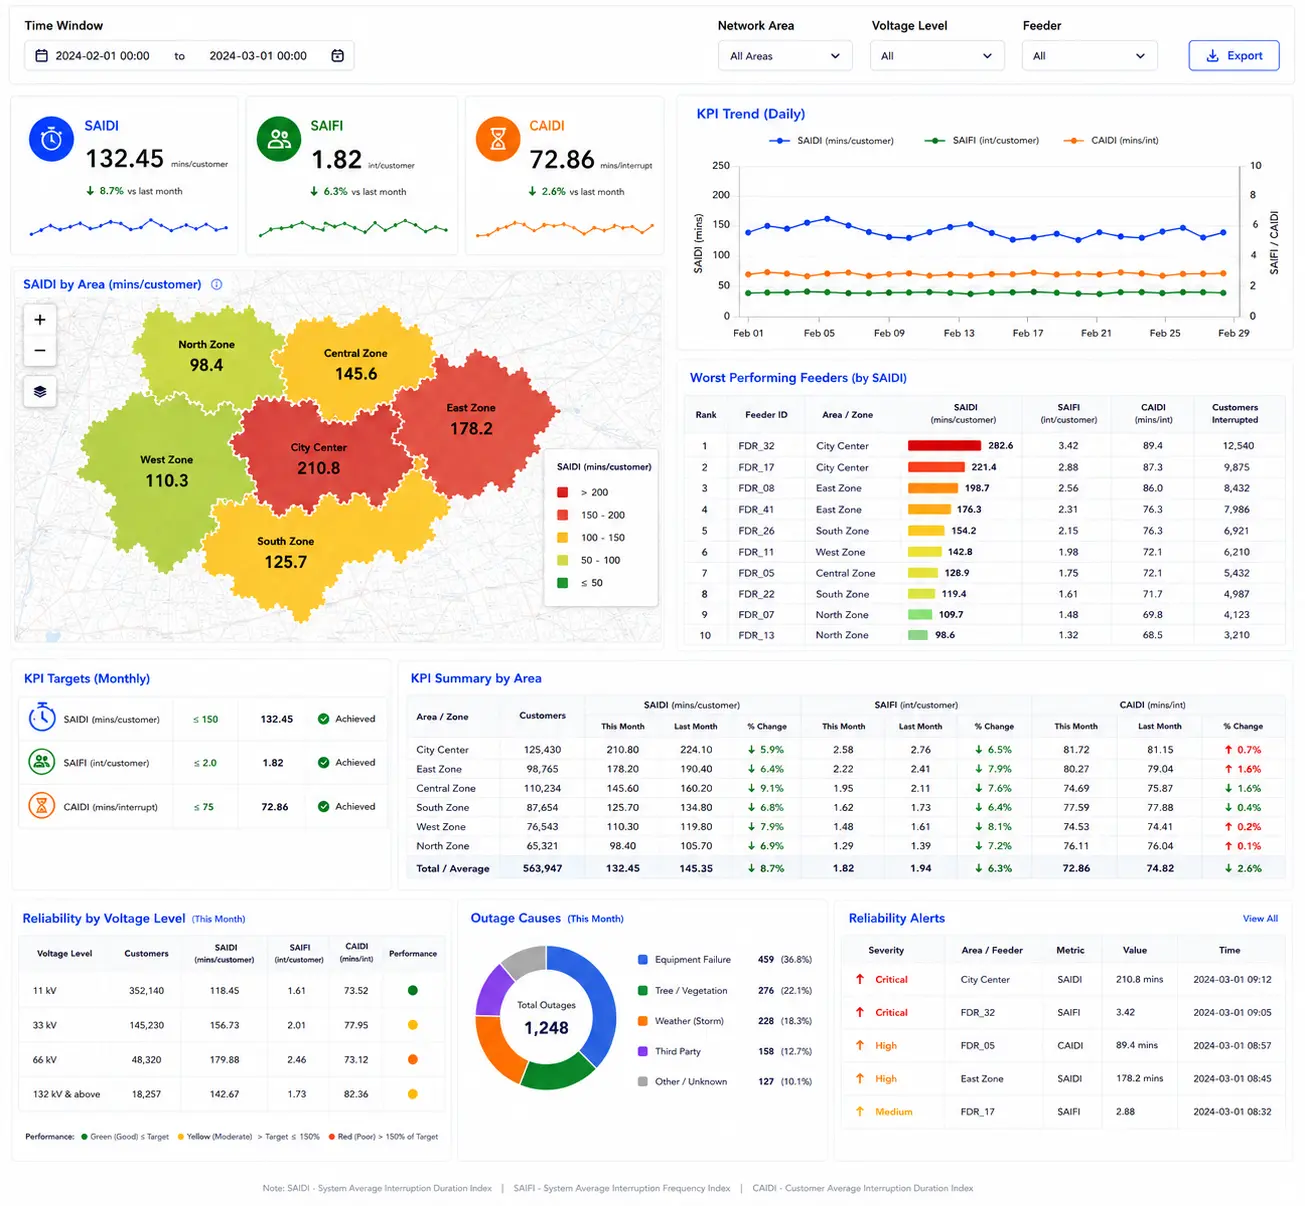
Manual reliability reporting delays visibility and weakens operational accountability.
Reliability indicators such as SAIDI, SAIFI and CAIDI were calculated manually after outages. This created delays, inconsistent reporting and limited auditability. Without timely feeder-level visibility, utilities faced challenges in identifying performance gaps, taking corrective action and demonstrating regulatory compliance.
Delayed KPI Visibility
Post-facto calculations limited timely insight into interruption duration and frequency across feeders and consumer zones.
Inconsistent Reporting
Fragmented systems and reporting formats produced misaligned KPI outputs and complicated compliance reviews.
Limited Auditability
Incomplete event trails and records made it harder to validate reported indices and resolve audit queries.
Weak Performance Linkage
Limited linkage between reliability indicators and incentive schemes constrained performance-based planning and accountability.
Automated reliability intelligence built on integrated grid data.
ReliabilityIQ™ brings SCADA, OMS and CRM information into a unified monitoring pipeline. Event detection and automated KPI computation provide timely reliability insights, standardised reporting and time-stamped records that support review and corrective action.
Grid Data Integration
Integrate SCADA feeds, OMS outage logs, CRM complaints and historical reliability datasets to establish a consistent monitoring data foundation.
Outage Event Detection
Apply event detection models to identify feeder and transformer outages in near-real time and associate events with relevant network and customer information.
Automated KPI Computation
Calculate SAIDI, SAIFI and CAIDI using logic aligned with IEEE 1366, supporting consistent and transparent reliability reporting.
Auditable Reporting & Benchmarking
Maintain time-stamped data pipelines and enable comparison of reliability indicators across divisions and reporting periods.
From operational event data to continuously updated reliability dashboards.
The deployment combines outage, operational and customer information to calculate reliability indices and present them through dashboards with feeder-level drill-downs and historical comparisons.
Input Data
SCADA feeds, OMS outage logs, CRM complaints and historical reliability datasets were combined for grid monitoring.
Processing
Outage events were detected and processed through automated KPI computation logic aligned with IEEE 1366.
Final Output
SAIDI, SAIFI and CAIDI dashboards with feeder-level drill-downs, comparative historical trends and actionable reliability insights.
Processing Scope
Coverage across DISCOM operational regions, with reliability indices updated continuously for daily monitoring.
One View of Grid Reliability
Monitor key indices, compare performance over time and drill down to feeder-level events.
A connected workflow from outage events to auditable reliability reporting.
Operational and customer systems feed a structured pipeline that detects interruption events, calculates indices and presents standardised information for operational and regulatory review.
Integrate Utility Systems
Connect SCADA, OMS, CRM and historical reliability data through a unified monitoring pipeline.
Detect Events & Calculate KPIs
Identify outage events and compute SAIDI, SAIFI and CAIDI using IEEE 1366-aligned logic.
Monitor & Report
Publish continuously updated dashboards, feeder-level drill-downs and auditable reports for review.
Delivered through ReliabilityIQ™ reliability monitoring and reporting capabilities, configured to the utility’s source systems, reporting requirements and operational structure.
More timely, transparent and consistent visibility into grid reliability.
Automated KPI monitoring replaces fragmented manual tracking with a shared view of reliability performance, helping utilities strengthen reporting discipline, identify issues sooner and connect operational results with improvement planning.
Automated Daily KPI Tracking
Near-real-time visibility into SAIDI, SAIFI and CAIDI supports more timely reliability oversight.
Regulatory Reporting Compliance
Automated IEEE 1366-aligned reports support transparent and audit-ready regulatory submissions.
Performance-Linked Planning
KPI visibility can be connected to incentive schemes, accountability and reliability-focused investment planning.
Operational Efficiency
Automated processing reduces manual KPI work and reporting errors, freeing analysts for higher-value tasks.
The source case study describes operational and reporting benefits but does not provide quantified percentage improvements or financial savings.
ReliabilityIQ™
AI-powered reliability KPI monitoring, outage intelligence, feeder-level insights and automated compliance reporting for utility networks.
Looking to automate reliability KPI monitoring and reporting?
Explore how ReliabilityIQ™ can help your utility improve visibility, strengthen auditability and support reliability-focused decisions.
Discuss this use case