Energy Loss Heatmap Generation
Locate technical and commercial energy losses across feeders and transformers with AI-powered heatmaps that help utilities focus audits and interventions where they are needed most.
Explore the use case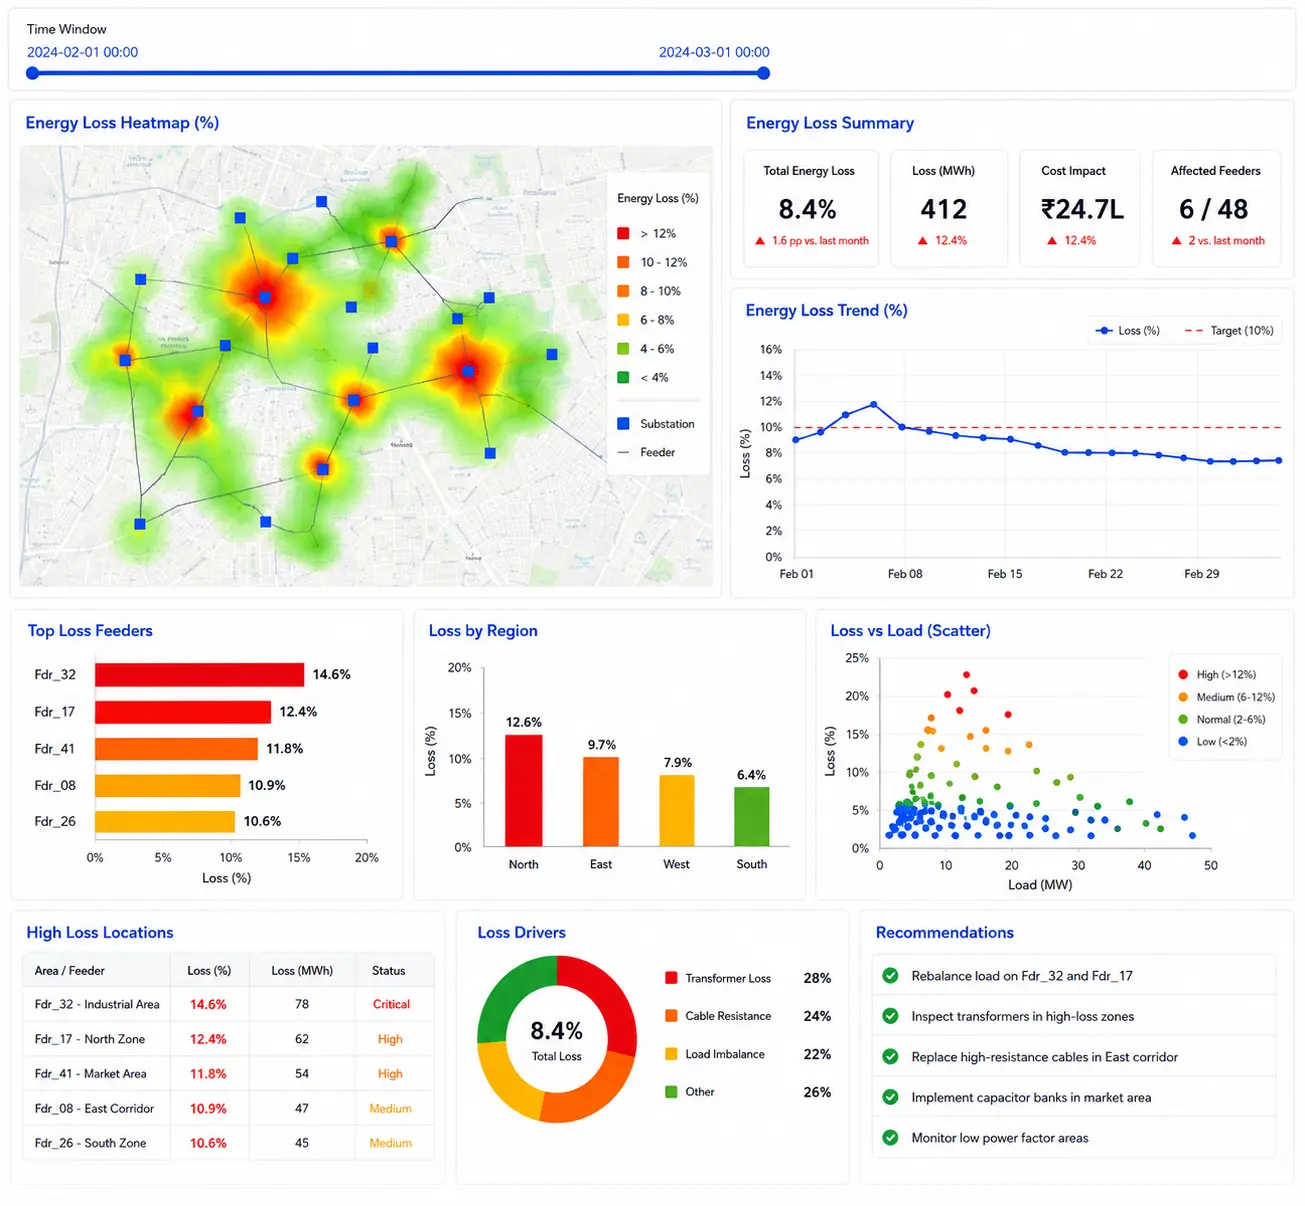
Energy losses can remain difficult to localise across feeders and transformers.
Distribution companies often struggle to identify where energy is being lost and whether the cause is technical inefficiency or commercial loss, including electricity theft. Without granular feeder- and transformer-level visibility, audit teams and planners can struggle to target inspections, validate losses and justify investments.
Limited Loss Visibility
Aggregate loss figures do not always reveal which feeders or transformers are contributing most to technical and commercial losses.
Delayed Theft Detection
Limited near-real-time monitoring can delay the identification and investigation of suspected electricity theft.
Manual Audit Processes
Fragmented audit workflows and manual data handling can slow validation and introduce inconsistencies.
CAPEX Justification
Planners need granular evidence to prioritise loss-reduction projects and support investment proposals under regulatory programmes.
AI-powered heatmaps expose feeder-level energy loss hotspots.
An AI-powered analytics pipeline combines load-flow modelling, energy audit information and automation to compare expected and actual consumption. Heatmaps and risk scores help identify mismatch zones, validate potential losses and rank feeders and transformers for targeted field investigation.
Load & Billing Data Integration
Combine AMR meter readings, distribution-transformer load profiles and billing records to establish feeder-level energy balances.
AI-Based Load-Flow Modelling
Compare expected and actual feeder consumption to surface anomalies and quantify potential loss patterns at granular levels.
Loss Hotspot Mapping
Use Sankey-based energy flow analysis to visualise mismatch zones and distinguish areas with potential technical or commercial losses.
Risk Scoring & Field Validation
Rank feeders and transformers by loss risk, then connect field inspection findings with billing and audit records to support corrective action.
From distribution data to mapped energy loss priorities.
The deployment ingests meter, transformer load and billing information to generate feeder- and transformer-level loss heatmaps, risk scores and actionable inspection priorities.
Input Data
AMR meter data, distribution-transformer (DT) load profiles and billing records were ingested for feeder-level loss analysis.
Analysis Engine
AI-based load-flow modelling and Sankey-style energy flow analysis highlighted mismatches between expected and actual consumption.
Outputs Generated
Delivered feeder and transformer loss heatmaps with risk scores to identify hotspots for corrective action.
Deployment Scope
Loss mapping workflows were applied across feeders, transformers and substations within regulatory compliance frameworks.
Loss Hotspots Across 22 Rural Feeders
Heatmaps and risk scores help field teams locate suspected loss hotspots and focus energy audits.
A connected workflow from energy data to targeted loss reduction.
Meter readings, DT load profiles and billing records are analysed to map energy mismatches, rank loss-prone feeders and guide field validation.
Integrate Meter & Billing Data
Bring together AMR readings, DT-wise load profiles and billing records.
Map & Score Loss Hotspots
Compare expected and actual feeder consumption, map mismatch zones and rank feeders by loss risk.
Validate & Prioritise Action
Connect field inspection findings with billing and audit records to validate losses and target corrective measures.
Delivered through the GridSense™ Loss Map Engine, configured around available AMR, DT load and billing data and the utility’s energy audit workflows.
Turn loss visibility into focused energy audit and recovery action.
Feeder- and transformer-level heatmaps help utilities identify suspected theft and technical loss hotspots, improve audit targeting and build evidence for loss-reduction investments.
Theft Detection Improved
Uncovered electricity theft across 22 rural feeders, strengthening revenue protection efforts.
Reduced AT&C Losses
Overall AT&C losses were lowered by 7.3% within the first year of deployment, as reported in the source case study.
Regulatory Compliance Enabled
Provided data-backed justification for AI-driven energy audit programmes under the RDSS framework.
Risk-Based Prioritisation
Ranked feeders and transformers by technical and commercial risk to focus field inspections and corrective investment.
Reported outcomes from the source case study: theft identified across 22 rural feeders and overall AT&C losses lowered by 7.3% within the first year. The source does not specify the absolute baseline, calculation methodology or exact loss category split.
GridSense™
AI-powered energy loss mapping and risk scoring to identify feeder and transformer hotspots, support energy audits and prioritise loss-reduction action.
Looking to identify and reduce energy losses across your distribution network?
Explore how GridSense™ can help your teams map loss hotspots, target energy audits and prioritise corrective investments.
Discuss this use case