CEMI-4/CEMI-5 Cluster Detection
Identify neighbourhoods and feeder zones experiencing recurring customer outages, so utility teams can focus reliability improvements where they matter most.
Explore the use case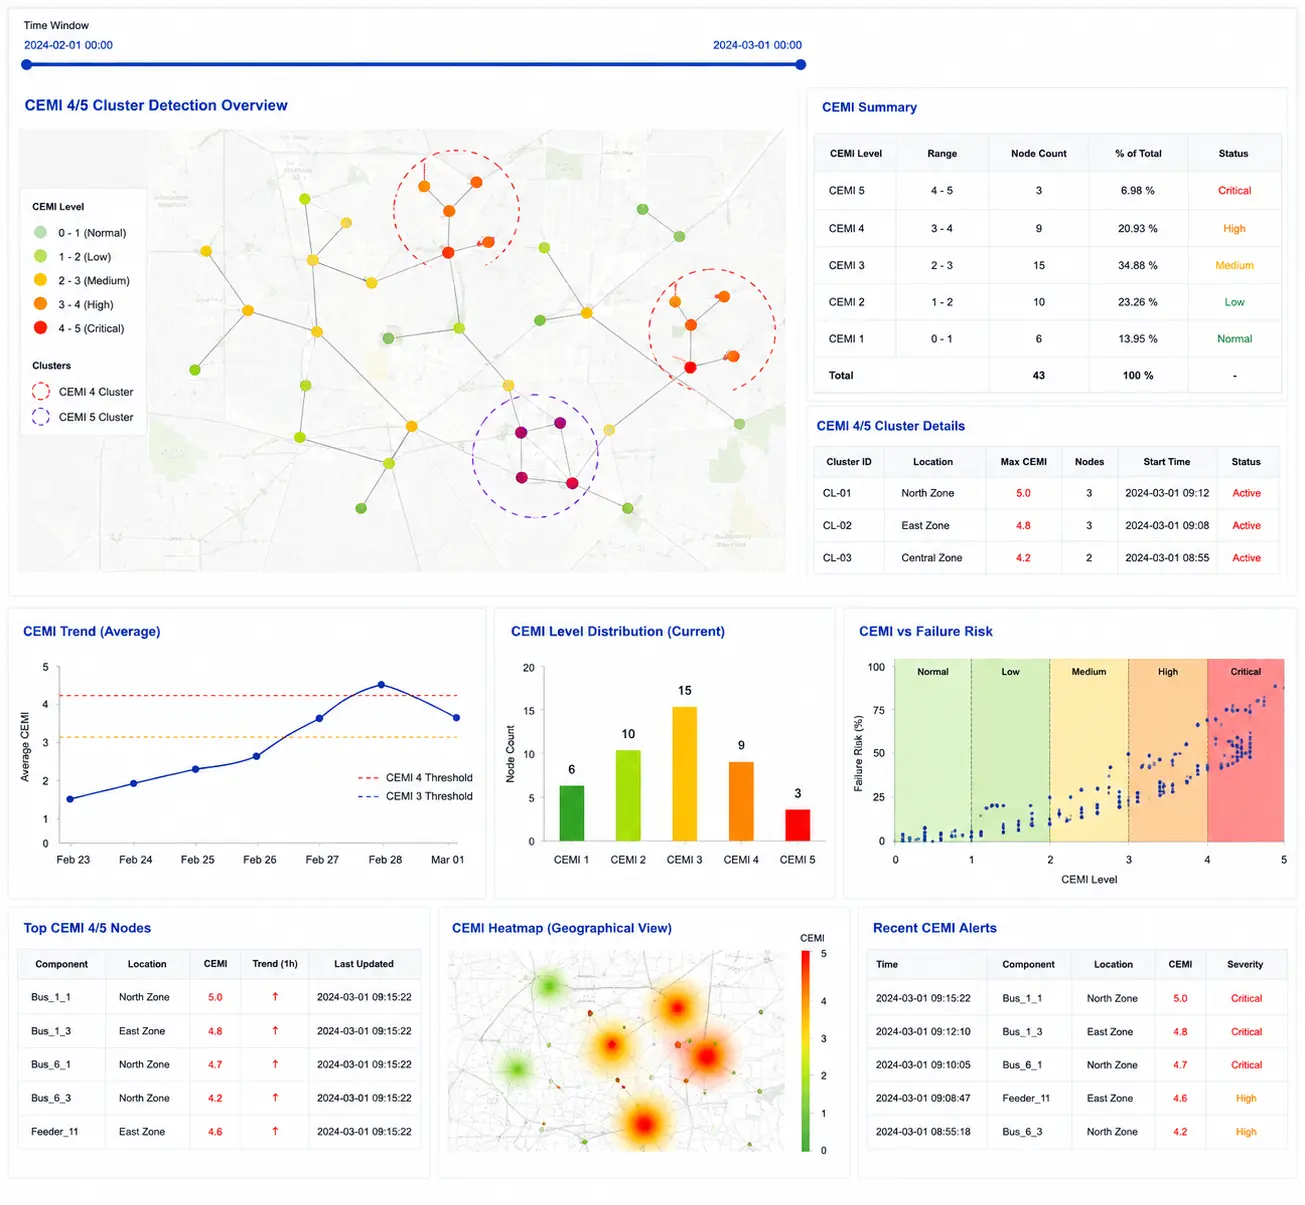
Recurring outages can remain hidden across customer and feeder data.
Distribution utilities need to understand not only how often outages occur, but where repeated interruptions affect customers. Without a clear spatial view of outage patterns, high-impact neighbourhoods and feeder problems can be overlooked, weakening reliability planning and investment decisions.
Hidden Outage Hotspots
Recurring interruptions across neighbourhoods may not be visible when event records are reviewed in isolation.
Reactive Grid Management
Without cluster-level insight, teams can struggle to move from repeated fault response to planned corrective action.
Fragmented Spatial Data
Disconnected outage logs and GIS consumer maps limit the ability to identify systemic feeder and location patterns.
Investment Prioritisation
Utilities need evidence to rank high-impact zones and direct reinforcement and automation investments effectively.
AI-powered geospatial clustering reveals recurring outage patterns.
An AI-driven geospatial pipeline combines outage event records with GIS consumer mapping data. Spatial and time-window clustering identifies recurring CEMI-4 and CEMI-5 hotspots, ranks their relative impact and gives operations and planning teams a clearer basis for corrective action and CAPEX prioritisation.
Outage & GIS Data Integration
Merge outage event logs with GIS consumer mapping data to connect interruption history with affected locations and neighbourhoods.
Spatial & Time-Window Clustering
Apply DBSCAN and time-window clustering algorithms to detect recurring CEMI-4 and CEMI-5 outage hotspots.
Cluster Impact Ranking
Rank detected clusters using outage frequency, consumer density, geographic spread and associated regulatory and economic impact.
Operational Alerts & Prioritisation
Share actionable alerts with grid operations and planning teams, highlighting high-risk feeder segments for investigation and intervention.
From outage history to mapped reliability priorities.
The deployment analyses historical interruption events alongside consumer geography to produce cluster layers, hotspot visualisations and reliability insights that support targeted utility planning.
Input Data
Outage logs, GIS consumer maps and three years of event history provided the inputs for the clustering analysis.
Processing Scope
Analysed 1.2 million meters across the utility service network and flagged 98 high-risk feeder zones.
Outputs Generated
Delivered cluster detection layers, CEMI-4/CEMI-5 hotspot visualisations and interactive reliability dashboards.
Deployment Environment
An AI-powered geospatial clustering engine with QGIS integration supported hotspot detection and timely alert notifications.
98 High-Risk Feeder Zones Identified
Cluster layers and hotspot views help teams locate recurring interruption patterns and focus investigation.
A connected workflow from outage events to targeted action.
Historical interruption data is combined with geographic consumer information, analysed for recurring patterns and translated into priorities for utility operations and planning.
Integrate Outage & GIS Data
Bring together outage event history, consumer locations and relevant network geography.
Detect & Rank Clusters
Identify recurring CEMI-4/CEMI-5 hotspots and rank them by frequency, density, spread and impact.
Prioritise Interventions
Use mapped cluster insights and alerts to guide feeder investigation, corrective work and investment planning.
Delivered through AI-powered geospatial clustering with QGIS integration, configured around available outage records, GIS data and utility planning workflows.
Turn recurring outage patterns into focused reliability improvements.
Geospatial cluster intelligence helps utilities understand where customer interruptions repeatedly occur, direct attention to high-impact feeder zones and make more evidence-based infrastructure decisions.
Improved Reliability Insight
Identified 98 CEMI-5 feeder zones associated with recurring outage clusters and reliability concerns.
Targeted CAPEX Planning
Supported prioritisation of rerouting, automation and reinforcement plans for high-impact feeders.
Regulatory Risk Reduction
Enabled systematic identification and proactive resolution of high-risk outage zones to help address non-compliance exposure.
Optimised Resource Allocation
Helped planners rank feeder zones by outage frequency, consumer density and overall impact.
Reported deployment scope: 1.2 million meters analysed and 98 high-risk feeder zones flagged. The source case study does not quantify percentage improvements in outage duration, reliability indices or financial savings.
ReliabilityIQ™
Grid reliability intelligence for identifying recurring outage patterns, monitoring performance and prioritising corrective action across utility networks.
Looking to identify recurring outage hotspots across your network?
Explore how AI-powered geospatial clustering can help your teams prioritise feeder interventions and reliability investments.
Discuss this use case